

In this chapter
We'll learn what DevOps really means — a way of working, not a job title — and how teams automate everything and observe their systems with logs, metrics, traces and alerts, explained as a restaurant where the cooks also hear what the diners think.
The Problem in Real Life
Anna reads a job advert out loud: "DevOps Engineer." Then another: "Backend developer — DevOps mindset required." "Is DevOps a job or a mindset?" John laughs. "Both, sadly. But the idea came first. Let me tell you how companies used to work."
"Developers wrote code and threw it over a wall to an operations team, who had to run it. When it broke at 3 AM, ops got woken up — and blamed the developers. The developers never saw their code suffer in production. Everyone was unhappy, and releases happened twice a year."
You build it, you run it.
John
A Wall Between Developers and Operations vs. One Team Owning the Whole Journey
Throwing code over the wall
When the people who write code never run it, they never learn what breaks.
Slow, scary releases
Manual handovers make releases rare, big and risky.
Not knowing what the system is doing
Without good logs, metrics and traces, every problem is a guessing game.
DevOps Culture, Automation, Monitoring, Logging and Alerting
The restaurant analogy: in a bad restaurant, the cooks never leave the kitchen and never hear what diners think — waiters take the complaints, and the same burnt dish goes out every night. In a good one, the cooks taste, watch the plates come back, and fix the recipe themselves. DevOps is the good restaurant: the people who build the software also see how it does in front of real users, and improve it.
- DevOps culture — one team, the whole journey: DevOps (development + operations) is a way of working where the same team is responsible for building, releasing and running its software. Key habits: shared ownership ("you build it, you run it", including being on call), small, frequent releases (Act 18, Act 19), automating repetitive work, measuring everything, and learning without blame (Act 19's blameless reviews).
- Infrastructure and deployment automation — let the machines do it: anything done more than twice by hand should become code: Infrastructure as Code (Act 20), Dockerfiles, pipelines, automatic rollbacks. Automation makes work repeatable, reviewable and fast, and it frees people for the problems that need thinking.
- Logging — the diary (Act 17, Act 19): in a container world, containers write logs to their standard output, and the platform collects them all into one central place. Because containers come and go, a log that stays inside a container would vanish with it.
- Monitoring and alerting — the vital signs: metrics such as error rate, latency, traffic and saturation (Act 19), on dashboards, with alerts that wake someone only for real problems that need a human. In Kubernetes, you also watch things like pods restarting again and again ("crash-looping").
- Tracing — following one order through the kitchen: with many services, one fan's request may pass through the web app, the seat-hold service, Redis, the database and a worker. A trace follows that single request through every service and shows how long each step took — like following one order slip through every station in the kitchen. Logs, metrics and traces together are called observability: being able to understand what's happening inside from the outside.
| Feature | A wall between Dev and Ops | DevOps |
|---|---|---|
| Who runs the code? | A separate ops team | The team that built it |
| Releases | Rare, big, scary | Small, frequent, automated |
| Setting up servers | By hand, from a wiki page | Infrastructure as Code |
| After an incident | Find who to blame | Blameless review, fix the process |
| Knowing it works | Wait for complaints | Dashboards, alerts, traces |
| Pillar | Restaurant version | Answers the question | BlueTicket example |
|---|---|---|---|
| Logs | The kitchen diary | What exactly happened? | payment_failed for order ord_88412 |
| Metrics | Vital signs on a screen | Is it healthy? Is it getting worse? | Email queue age, checkout error rate |
| Traces | Following one order slip | Where did this request spend its time? | Checkout: 40 ms web, 900 ms payment API |
BlueTicket's DevOps changes after the worker incident: every service has an owner listed in its README; developers join the on-call rota (with John as backup for newcomers). Each service has a standard dashboard: requests, errors, latency, queue length, pod restarts. A new alert: "email queue older than 5 minutes" — on Tuesday, that would have fired four minutes into the incident, before the first fan contacted support. And tracing is switched on, so a slow checkout can be followed through every service.
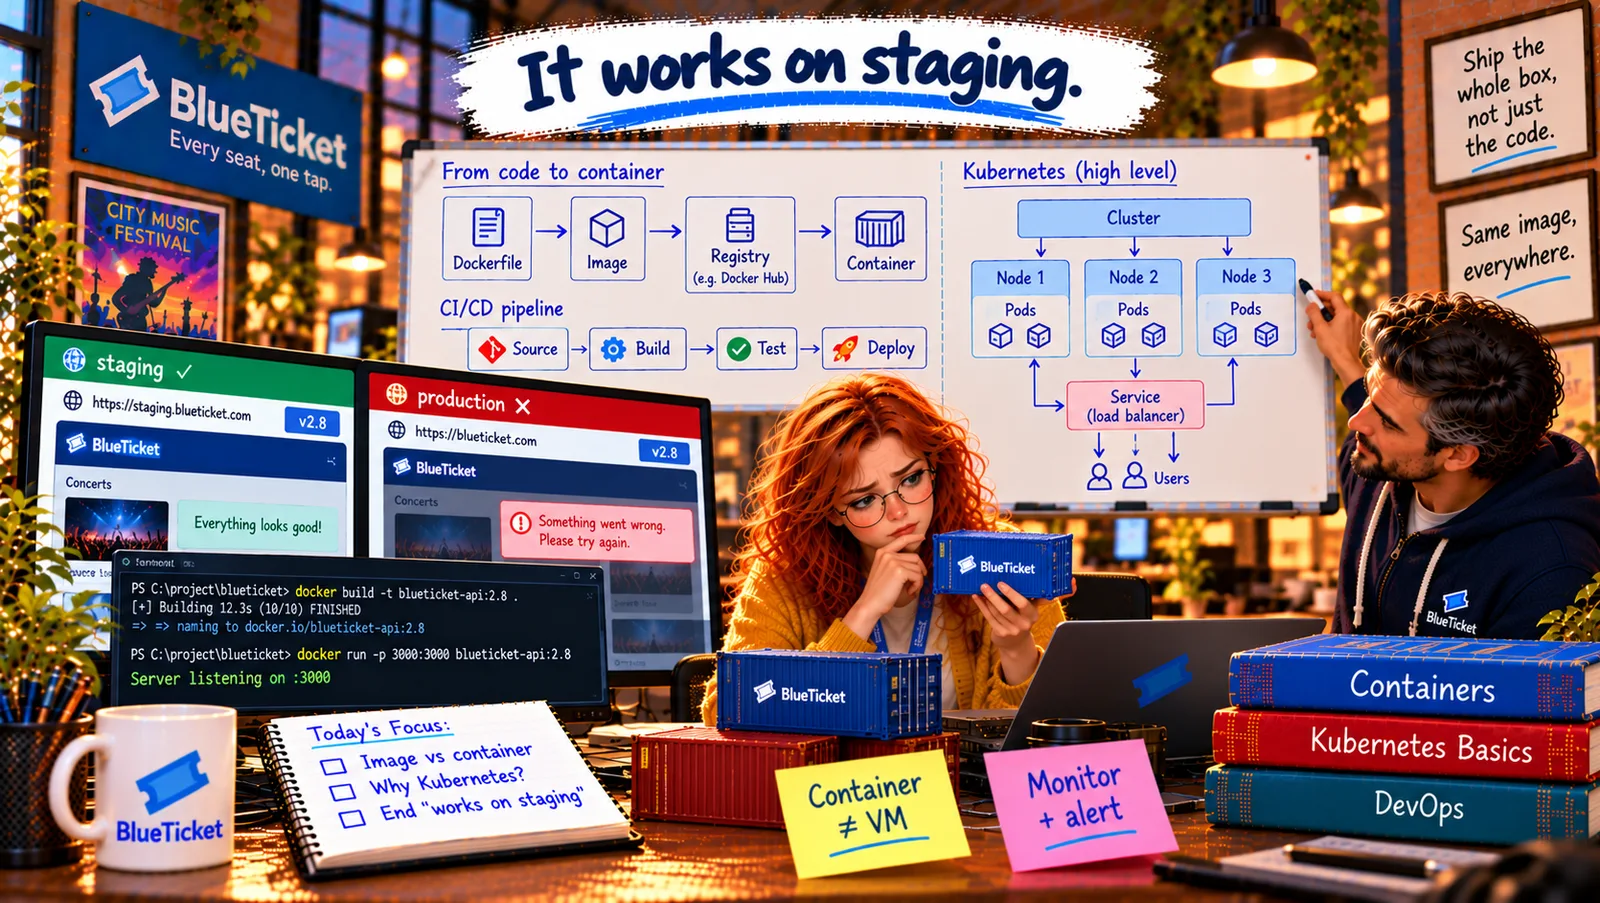
The close: a week later, a new release of the web app goes out — the same image that passed every test in staging. It works in production, because it is the same box. Anna takes down the sticky note "It works on staging" from her monitor and writes a new one: "Same image, everywhere."
Key Takeaway
DevOps is a culture where one team builds, releases and runs its software — you build it, you run it — with small frequent releases, automation of everything repetitive, measurement and blameless learning. Observability means understanding a system from the outside through logs (collected centrally, since containers come and go), metrics with dashboards and alerts, and traces that follow one request through every service.
Why This Matters
Almost every modern software team works in a DevOps way to some degree, and "you build it, you run it" means even junior developers look at dashboards, read logs and join on-call. Understanding observability — logs, metrics, traces and alerts — is what lets you find out what's really happening when something goes wrong in a system of many containers.
The worker incident led to containers for everything, one pipeline for everything, and a team that watches its own software. John gives Anna one last exercise: explain BlueTicket's whole journey, from a line of code to a container running in a cluster.