

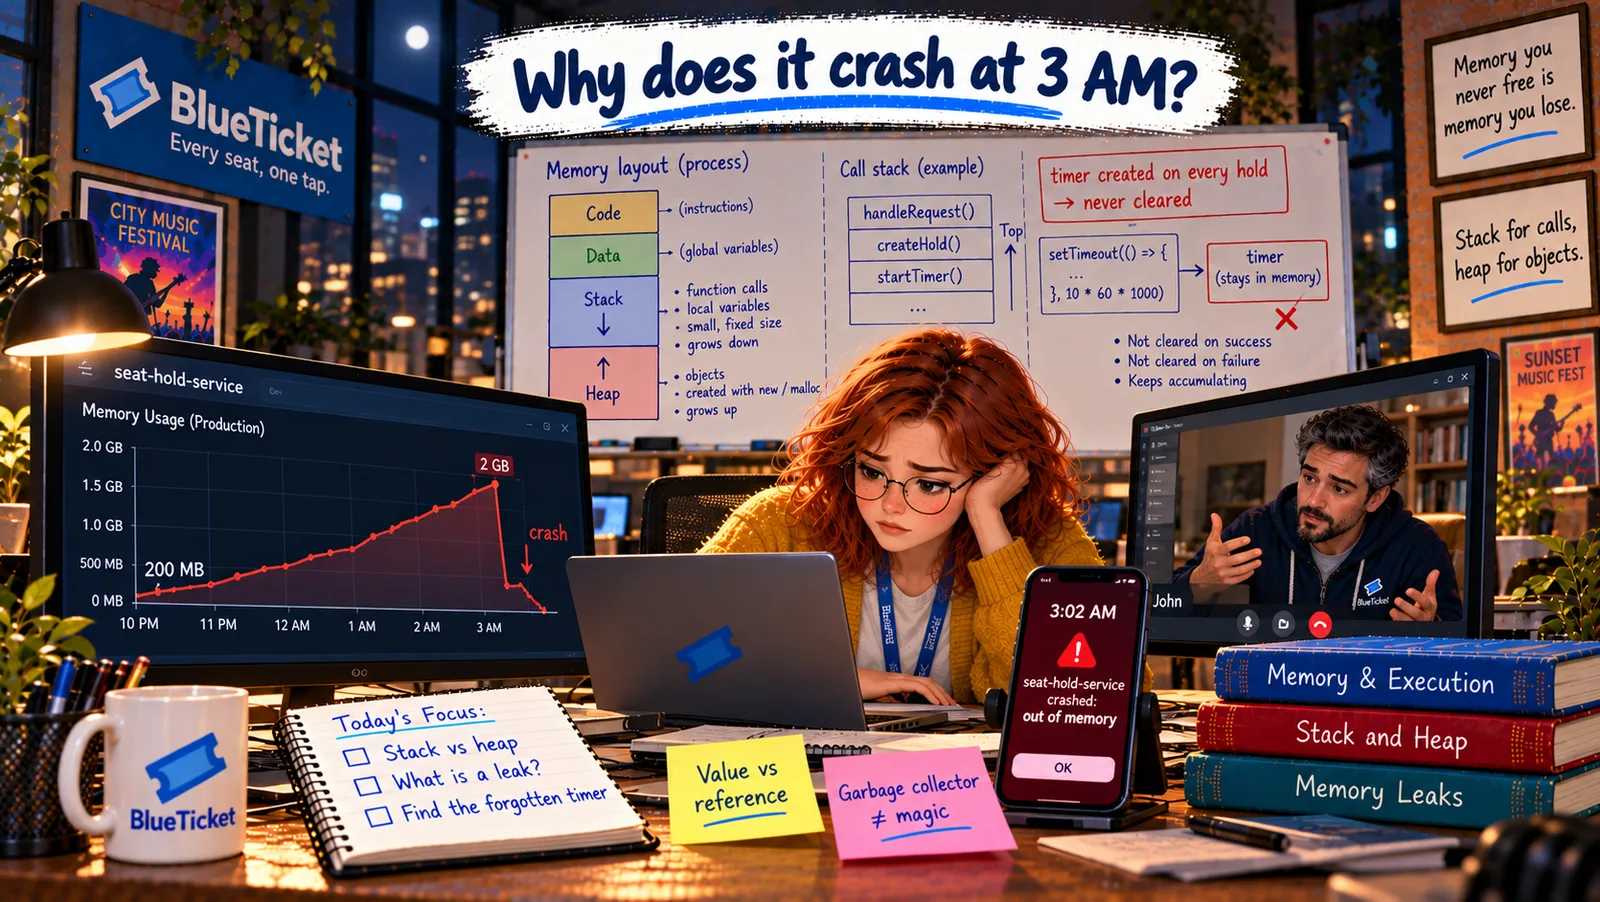
In this chapter
We'll learn why memory bugs happen and how to recognise the main ones — memory leaks (taps left running) and dangling references (a key to a room that's been given to someone else) — then find and fix the 3 AM leak and prove it with the memory graph.
The Problem in Real Life
Anna knows the cause. Now she has to fix it — and prove it's fixed, because "it didn't crash last night" isn't proof. The crash might just be waiting for a busier day.
John pins two printed graphs on the wall. One is a slow, steady climb to 2 GB. The other is a saw: up, down, up, down, always coming back to the same level. "By the end of today," he says, "your service should look like the saw."
Healthy memory breathes in and out. Leaking memory only breathes in.
John
"It Crashed, Restart It" vs. Finding What's Holding On
Leaks grow slowly
A leak isn't one big mistake — it's a tiny one, repeated thousands of times until memory runs out.
The graph tells the story
The shape of the memory graph shows whether memory is being given back.
Restarting hides the problem
Restarts reset the memory, but the leak starts again immediately.
Memory Bugs: Leaks and Dangling References
Why memory bugs happen: memory is invisible, it works perfectly on small tests, and problems only appear after hours or days of real use. A leak of 5 KB per request is invisible in a 10-minute test and fatal after 300,000 requests. That's why memory bugs are some of the trickiest to find — and why reading the memory graph is so useful.
- Memory leak — a tap left running: imagine leaving a tap dripping in a sink with no drain. Each drip is tiny. But after a day, the sink overflows. A memory leak is memory that's no longer needed but never given back. Each leaked piece is small; the program keeps leaking until it runs out of memory and crashes — or gets slower and slower first, as the garbage collector works harder and harder.
- Common leaks in garbage-collected languages: a global list, map or cache that only ever grows; timers or intervals that are never cleared; event listeners added again and again and never removed; closures that capture big objects and are kept forever. All the same shape: something reachable keeps holding references to things you're finished with.
- Dangling reference — a hotel key after checkout: imagine you still have a key card to room 512 after you checked out — and the hotel has already given the room to someone else. If you use the key, you walk into a stranger's room. A dangling reference (or dangling pointer) points to memory that has already been freed and maybe reused for something else. In C and C++ this is the classic use-after-free bug: the program reads garbage, crashes, or — worse — becomes a security hole (Act 22). Garbage-collected languages largely prevent it, because memory is never freed while something still references it.
- The close cousin in JavaScript — a stale reference: you can still hold an outdated object: for example, keeping an old copy of a seat object after the real seat changed. It's not a crash, but the code acts on old data. The fix is the same idea: don't hold on to things longer than you need them.
| Bug | Everyday picture | What happens | Languages |
|---|---|---|---|
| Memory leak | A tap left running | Memory grows until the program slows or crashes | All languages |
| Dangling reference (use-after-free) | A hotel key after checkout | Reads freed or reused memory: crashes, wrong data, security holes | Mainly C and C++ |
| Stale reference | An old phone number for a friend who moved | Code acts on outdated data | All languages |
| Stack overflow | A pile of trays hitting the ceiling | Crash from too-deep recursion | All languages |
| Leak pattern | Fix |
|---|---|
| Global map or list that only grows | Remove entries when done, or limit its size |
| Timers or intervals never cleared | clearTimeout / clearInterval when no longer needed |
| Event listeners added again and again | Remove listeners, or add them only once |
| Cache without a size or time limit | Evict old entries (size limit or expiry) |
| Closures capturing large objects, kept forever | Capture only what's needed; release the function |
| Version | Memory after 1 hour of simulated holds | Graph shape |
|---|---|---|
| Before | Over 1.5 GB and still climbing | Rising floor — leak |
| After | Between 190 and 240 MB, steady | Saw — healthy |
Reading the memory graph
Healthy: a saw
up and down, always back to the same level
Leaking: a rising floor
each low point a little higher than the last
Garbage collector frees memory
nothing is holding old objects
Garbage collector can't free it
something reachable still references old objects
Runs for months
Crashes: heap out of memory
after hours or days
const timers = new Map();function holdSeat(seatId, fanId) {const timer = setTimeout(() => endHold(seatId, "expired"), HOLD_DURATION_MS);timers.set(seatId, timer);// ...}// Called when a hold ends for ANY reason: paid, released or expiredfunction endHold(seatId, reason) {clearTimeout(timers.get(seatId)); // stop the timer if it's still waitingtimers.delete(seatId); // remove the reference -> the GC can free it// ...update the seat's state (SOLD or FREE) depending on reason}
The bug was never the timer itself. It was the map holding on to every timer forever. One delete per hold turns a rising floor into a saw.
Reading the memory graph: a healthy program's memory looks like a saw: it rises as work creates objects, then drops each time the garbage collector cleans up, always returning to roughly the same level. A leaking program's memory also has small teeth, but the bottom of each tooth is a little higher than the last — the whole line slowly climbs. That rising floor is the signature of a leak.
Fixing the 3 AM leak: Anna makes two changes. First, every time a hold ends — paid, released, or expired — the service clears that seat's timer and removes it from the map: clearTimeout(timer) and timers.delete(seatId). Now nothing keeps old timers reachable, and the garbage collector can do its job. Second, she remembers Act 08's design: instead of 300,000 separate timers, one small job could run every minute and release all expired holds. She adds a note to the backlog to switch to that simpler design later.
Proving the fix: she runs a load test that simulates a full day of holds in an hour, and watches the graph. Before the fix: a steady climb past 1.5 GB. After: a saw between 190 and 240 MB, perfectly flat across the whole hour. That night, and every night after, the 3 AM alert stays quiet.
Key Takeaway
A memory leak is like a tap left running: memory no longer needed but never released, tiny each time until the program runs out. In garbage-collected languages it's always something reachable — a global map, a timer, a listener, a closure — holding references too long. A dangling reference is a key to a room already given away (use-after-free in C/C++). Healthy memory graphs look like a saw; a rising floor means a leak.
Why This Matters
Memory leaks are one of the most common causes of services that "randomly" crash at night, slow down over days, or need regular restarts. On Sale Day, 50,000 fans will create holds in an hour — the old leak would have crashed the service in minutes. Knowing the leak patterns, and how to read a memory graph, lets Anna catch problems like this long before customers notice.
The 3 AM alert is quiet. John has one last exercise before Act 11: a different service, a different graph, and a small piece of code with a leak hidden in it.