

Playground Checkpoint
Design and build a real schema — no auto-grading, just a real attempt.
The Challenge
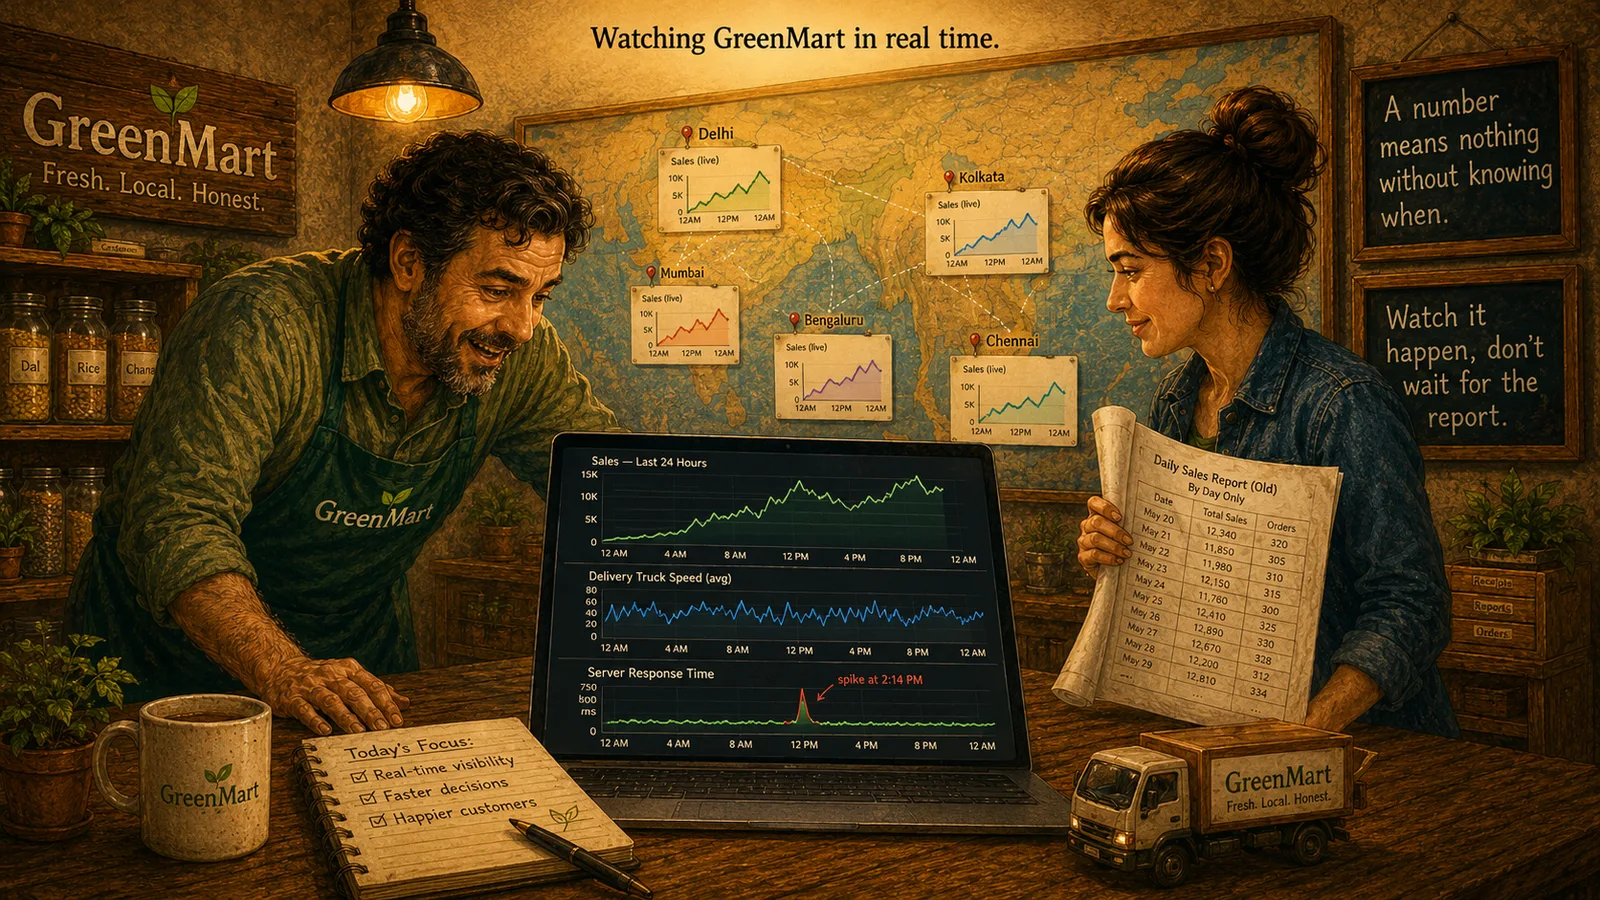
Five chapters of real time-series data, all converging on one real challenge: build GreenMart's actual operations dashboard, the way this whole Act argued it should work — trends read from real rollups, not a pile of raw points.
Open the Playground and build it for real: insert tagged sales counts for two regions across three points in time, query one region's own series back, roll the whole metric up into real 5-minute windows, and then insert one more, late-arriving point and watch an already-reported window correctly update.
What Your Operations Dashboard Needs
- At least six INSERT statements for one metric (e.g. sales.count), tagged with a low-cardinality tag like region (north/south) — real, meaningfully repeating tag values, not the high-cardinality mistake this Act's own closing chapter warned about.
- One QUERY filtered by WHERE to a single tag value, returning just that region's own points.
- One QUERY using GROUP BY with a real AGG(sum|avg|min|max|count), rolling the raw points up into real time windows.
- One more INSERT, timestamped earlier than points already in an already-queried window (a late-arriving point) — then the exact same GROUP BY query again, showing that window's value has genuinely changed.
Stuck? A Few Hints
- Reread downsampling-and-retention's own worked example — this checkpoint reuses the exact same GROUP BY shape, just with your own tag and points.
- Reread out-of-order-data's own worked example for exactly how to demonstrate a late point updating an already-reported rollup — insert it after your first GROUP BY query, then run that identical query again.
- Keep your tag values few and repeating (like region=north/south) — a tag that's different on every single point won't group into anything meaningful, which is exactly the mistake the cardinality chapter warned about.
Ready to Build It?
Opens the Playground, right in your browser — nothing to install.
Every command should return a real result — an inserted point, a list of matched points, or a rolled-up set of windows (rendered as a real bar chart). The second, identical GROUP BY query should report a genuinely different value for the window your late point landed in — that's the checkpoint working correctly, not a sign something went wrong.
Before You Move On
Six real, tagged points, a filtered query, a real windowed rollup rendered as a bar chart, and a late point genuinely changing an already-reported window's value — that's the whole Act, in one script: time isn't just another column, it's what the entire workload is organized around, from how points get written to how a late one still gets counted correctly. The next Act moves from finding things by exactly what they say to finding things by what they mean.