

In this chapter
We'll turn a real stream of raw points into a genuine rollup — a GROUP BY window rendered as an actual bar chart — and meet retention and data expiration as a deliberate policy, landing this Act's own core realization concretely.
The Problem in Real Life
A full day of server response times, one point every few seconds, is over twenty thousand individual numbers. Sarah pulls them up as a raw list, and it's genuinely useless — a wall of numbers nobody can read as a trend, even though every single one of them is a real, correct measurement.
Mike doesn't want twenty thousand numbers. He wants one chart he can glance at.
I don't need every second. I need to see the shape of the day.
Mike
A Wall of Points vs. A Chart You Can Actually Read
Downsampling reduces without losing the trend
Fewer, summarized points per time window — the shape of the day, not every individual second.
A rollup is a real aggregation per window
Sum, average, min, or max — computed directly from the raw points inside each window, verified: 25 and 45.
Retention is a deliberate policy
Raw data kept briefly, rollups kept longer — trading precision for storage cost as data ages, on purpose.
A first-class operation, not a workaround
Automatically summarizing and expiring old data by age has no real equivalent in a relational or document database.
Downsampling, Rollups & Retention
Downsampling is exactly this: taking a dense stream of raw points and reducing it to fewer, summarized points — one per time window — without losing the actual shape of the trend. A rollup is the summarized result itself: instead of every individual reading, a rollup holds one aggregation (a sum, an average, a min, a max) per window, computed directly from the raw points that fall inside it.
Four raw sales counts, five minutes apart. GROUP BY 10m AGG(sum) rolls them into two 10-minute windows: the first (0-10m) sums 10+15=25; the second (10-20m) sums 20+25=45. This isn't a hypothetical — it's the real, verified output of this course's own time-series simulator, and it renders as an actual small bar chart in the Playground's output panel, not just numbers.
INSERT sales.count 10 at +0mINSERT sales.count 15 at +5mINSERT sales.count 20 at +10mINSERT sales.count 25 at +15mQUERY sales.count FROM +0m TO +20m GROUP BY 10m AGG(sum)
This is the literal mechanism behind "yesterday in one chart, not a million rows" — a real GROUP BY window, not a metaphor.
Retention and data expiration are the other half of this same discipline: deciding, on purpose, how long raw, second-by-second data is actually worth keeping. A real production system typically keeps raw points for a short window (a few days, say), keeps hourly rollups for longer (a few months), and daily rollups longer still — trading precision for storage cost as data ages, since nobody genuinely needs second-by-second server response times from eight months ago. This is a deliberate, honest policy decision, not data loss by accident.
This is also where this Act's own Core Realization stops being an abstract sentence and becomes something you can point at directly: a relational or document database has no equivalent built-in concept of "automatically summarize old rows and eventually drop the originals, based purely on age." A time-series database treats that as a first-class, expected operation — because time genuinely is the dimension the entire workload, storage included, is organized around.
Key Takeaway
Time is not just another column when time is the dimension the entire workload is organized around. Downsampling and retention are that realization made concrete: a database that treats time as central doesn't just store timestamps — it knows how to summarize by them, and eventually let old precision go, on purpose.
Why This Matters
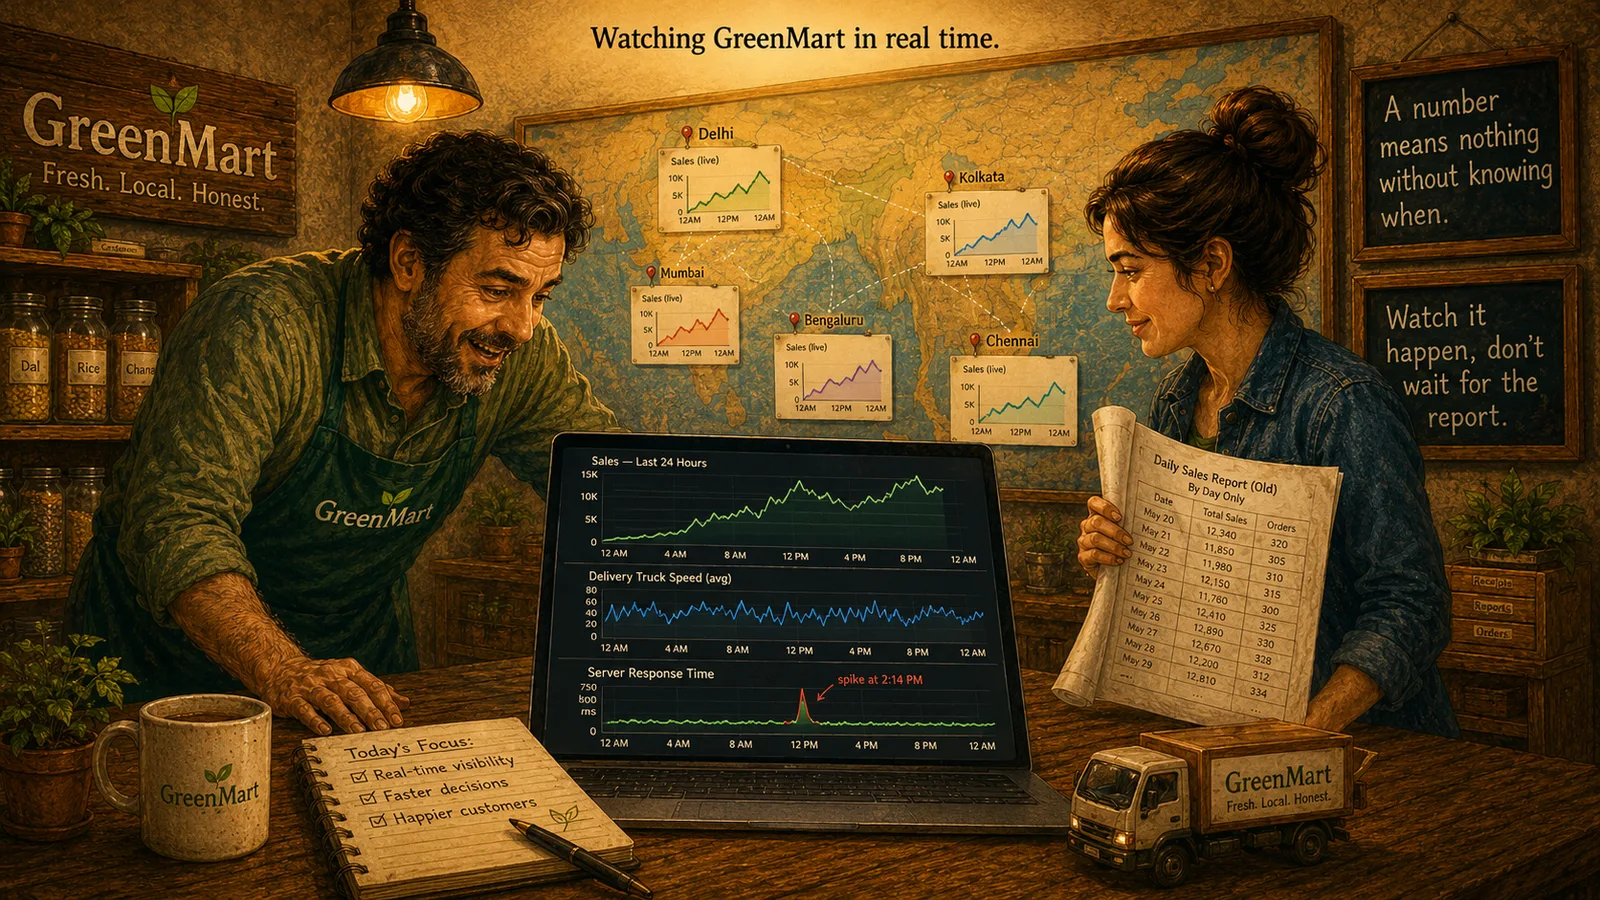
Every dashboard GreenMart actually looks at day-to-day is a rollup, not a raw stream — this is the real mechanism behind every chart in this Act's own hero image. Retention policy decisions made here directly shape what GreenMart can and can't ask about the past later.
GreenMart can now turn a day's worth of raw points into one readable chart, and has a real policy for how long full precision is worth keeping. None of this accounts for a reading that shows up late, out of order, though — exactly where the next chapter goes.